1] Is it possible to retrieve "Lost ticks" (Not 1min LTPs) of current day's Futures or Options before 3:30pm. How? 2] Is it possible to get "ticks" (Not 1min LTPs) of previous day's NFO. Any KiteConnect API? 3] Assuming an efficient coding; how may ticks can be received per second? Any approx. rate? 4] Is it possible to find a huge spike between two adjacent 1min LTP values regardless of scrip's volatility? Please kindly look for attachment what I actually mean! What about two adjacent ticks received out of the millions actually on NSE server. Any probability?
Request to clarify as it will take a big leap ahead for me!!
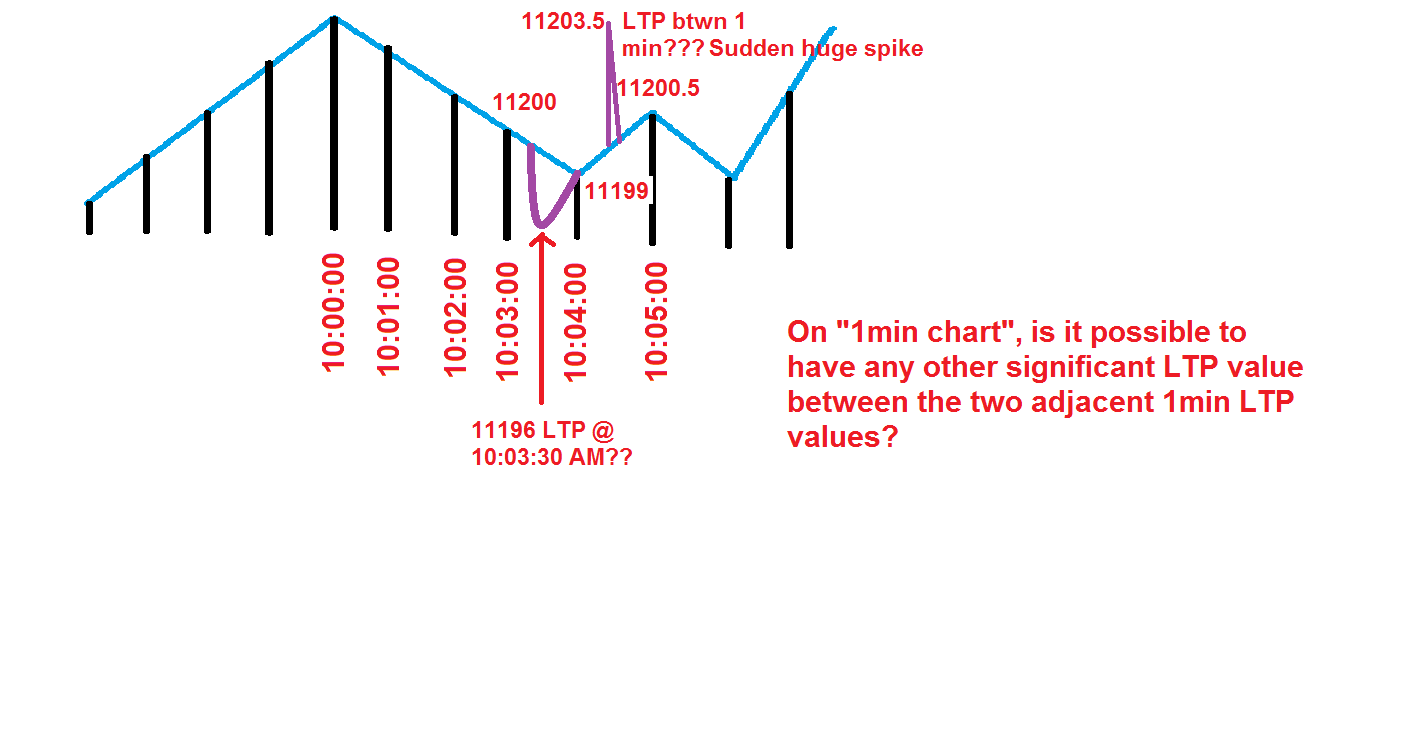
@sagaranilganu, 1. No, it is not possible to fetch lost ticks currently. 2. No, we don't store tick data(It is only streamed live). You can use the historical API to fetch minute candle data only. 3. A user can expect a maximum of 1 tick per second per instrument. 4. Yes, it is possible to find a huge spike between 2 adjacent 1-min candles. As you mentioned, out of the thousands(or millions) of trades executed, we would receive any 60 ticks(or lesser for low volume scrips) and the OHLC is generated out if this. For the screenshot attached, I'm guessing you are referring to Nifty 50 candles, the 7 points move is not unusual in a minute or two. Is it?
First thanks for generous answers. But a little more is required!!! 4] The graph is actually an idea of "1min" charting timeline and Y-axis is pure assumption. My intention was to have a 1min graph with a straight decaying line without any glitch as is seen on Kite. Let me correct values with change as a straight fall from 11200 to 11190 instead of just 1 Re. (a) Without glitch :: 11200 -> 11190 within 1min (values will be within say 3+ and 3- range) :: My old understanding (b) With glitch :: 11200 -> 11205 -> 11195 -11185 - 11180 - 11190 within 1min :: My new understanding. Virtually any high or low value is a possibility. Correct??? 5] Another imp. confirmation reqd. :: Are all the above-said values "Traded with Buy-Sell actually happening" ones or "Just Bulls & Bears are tussling each other"
@sagaranilganu, So every tick that you receive is a trade that has executed on the exchange(A willing buyer and seller at the same price). There will be many more trades in that second for liquid instruments but you will receive only 1. So a fall from 11200 to 11190, might not necessarily mean that it happens in a linear fashion(Point (b) is correct). Trades can be at all price points and the OHLC is built using all the ticks captured.
Utmost thanks for all the generous answers. Especially with lengthy questions, but was necessary too!! Special thanks for upfront OHLC insight which was my obvious question All this will help me tweak my core strategy before-hand itself. Great support n mentoring!!

1. No, it is not possible to fetch lost ticks currently.
2. No, we don't store tick data(It is only streamed live). You can use the historical API to fetch minute candle data only.
3. A user can expect a maximum of 1 tick per second per instrument.
4. Yes, it is possible to find a huge spike between 2 adjacent 1-min candles. As you mentioned, out of the thousands(or millions) of trades executed, we would receive any 60 ticks(or lesser for low volume scrips) and the OHLC is generated out if this.
For the screenshot attached, I'm guessing you are referring to Nifty 50 candles, the 7 points move is not unusual in a minute or two. Is it?
4] The graph is actually an idea of "1min" charting timeline and Y-axis is pure assumption.
My intention was to have a 1min graph with a straight decaying line without any glitch as is seen on Kite.
Let me correct values with change as a straight fall from 11200 to 11190 instead of just 1 Re.
(a) Without glitch :: 11200 -> 11190 within 1min (values will be within say 3+ and 3- range) :: My old understanding
(b) With glitch :: 11200 -> 11205 -> 11195 -11185 - 11180 - 11190 within 1min :: My new understanding. Virtually any high or low value is a possibility. Correct???
5] Another imp. confirmation reqd. :: Are all the above-said values "Traded with Buy-Sell actually happening" ones or "Just Bulls & Bears are tussling each other"
So every tick that you receive is a trade that has executed on the exchange(A willing buyer and seller at the same price). There will be many more trades in that second for liquid instruments but you will receive only 1. So a fall from 11200 to 11190, might not necessarily mean that it happens in a linear fashion(Point (b) is correct).
Trades can be at all price points and the OHLC is built using all the ticks captured.
Special thanks for upfront OHLC insight which was my obvious question
All this will help me tweak my core strategy before-hand itself.
Great support n mentoring!!