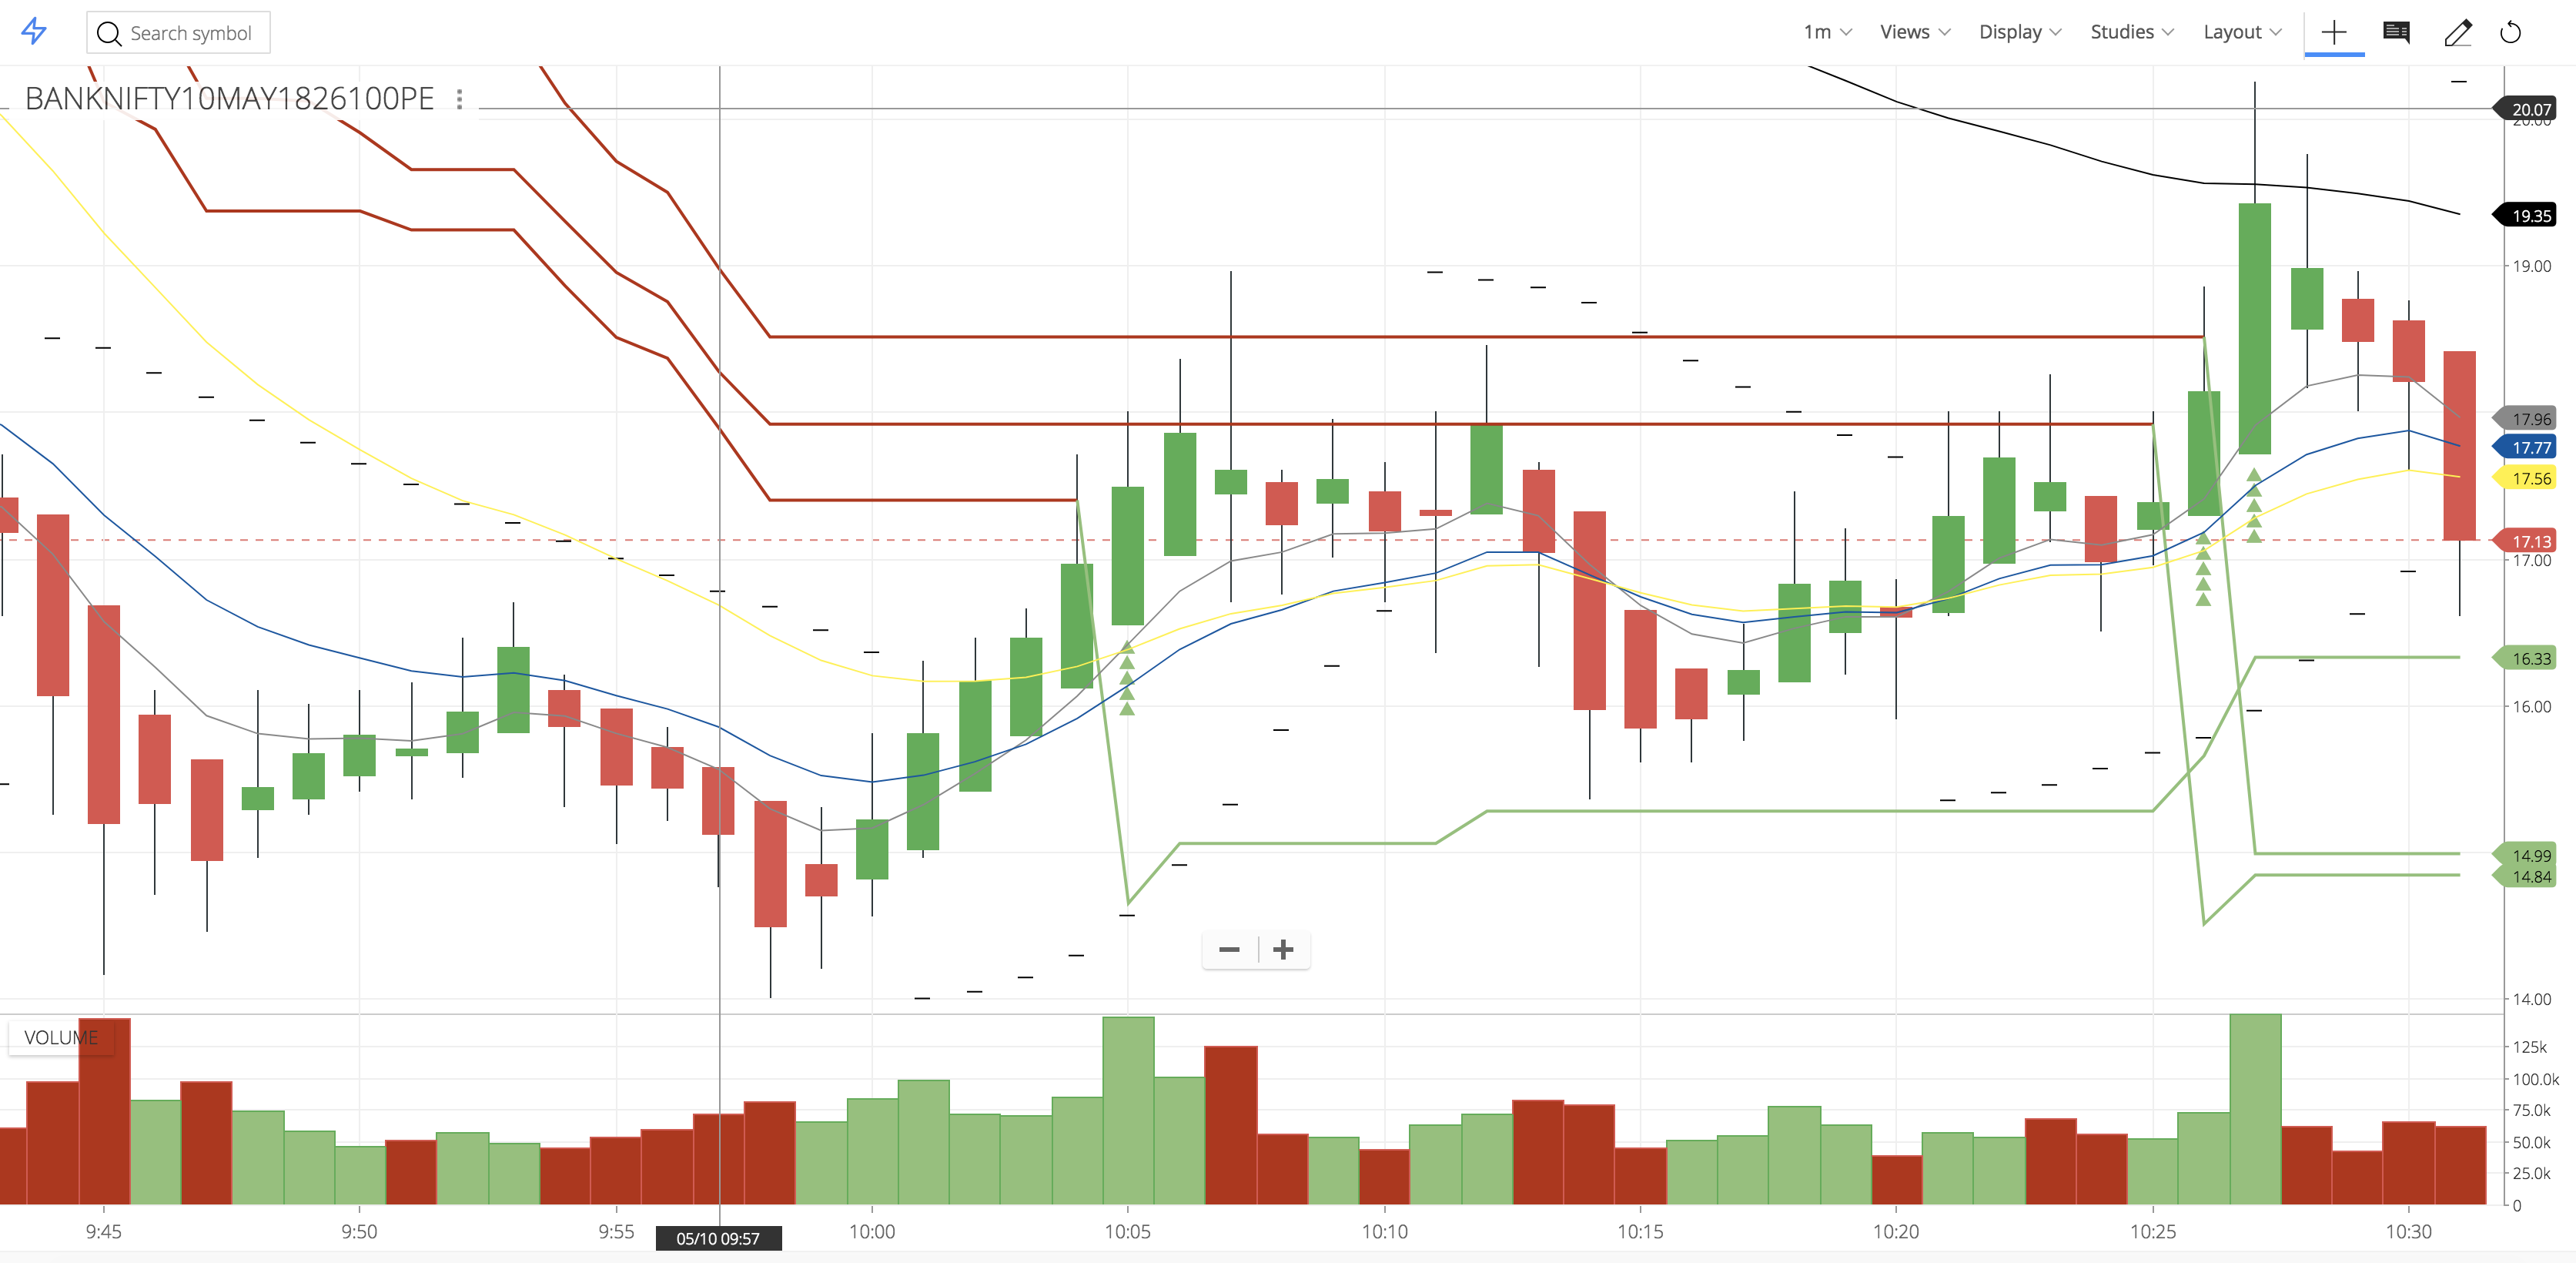
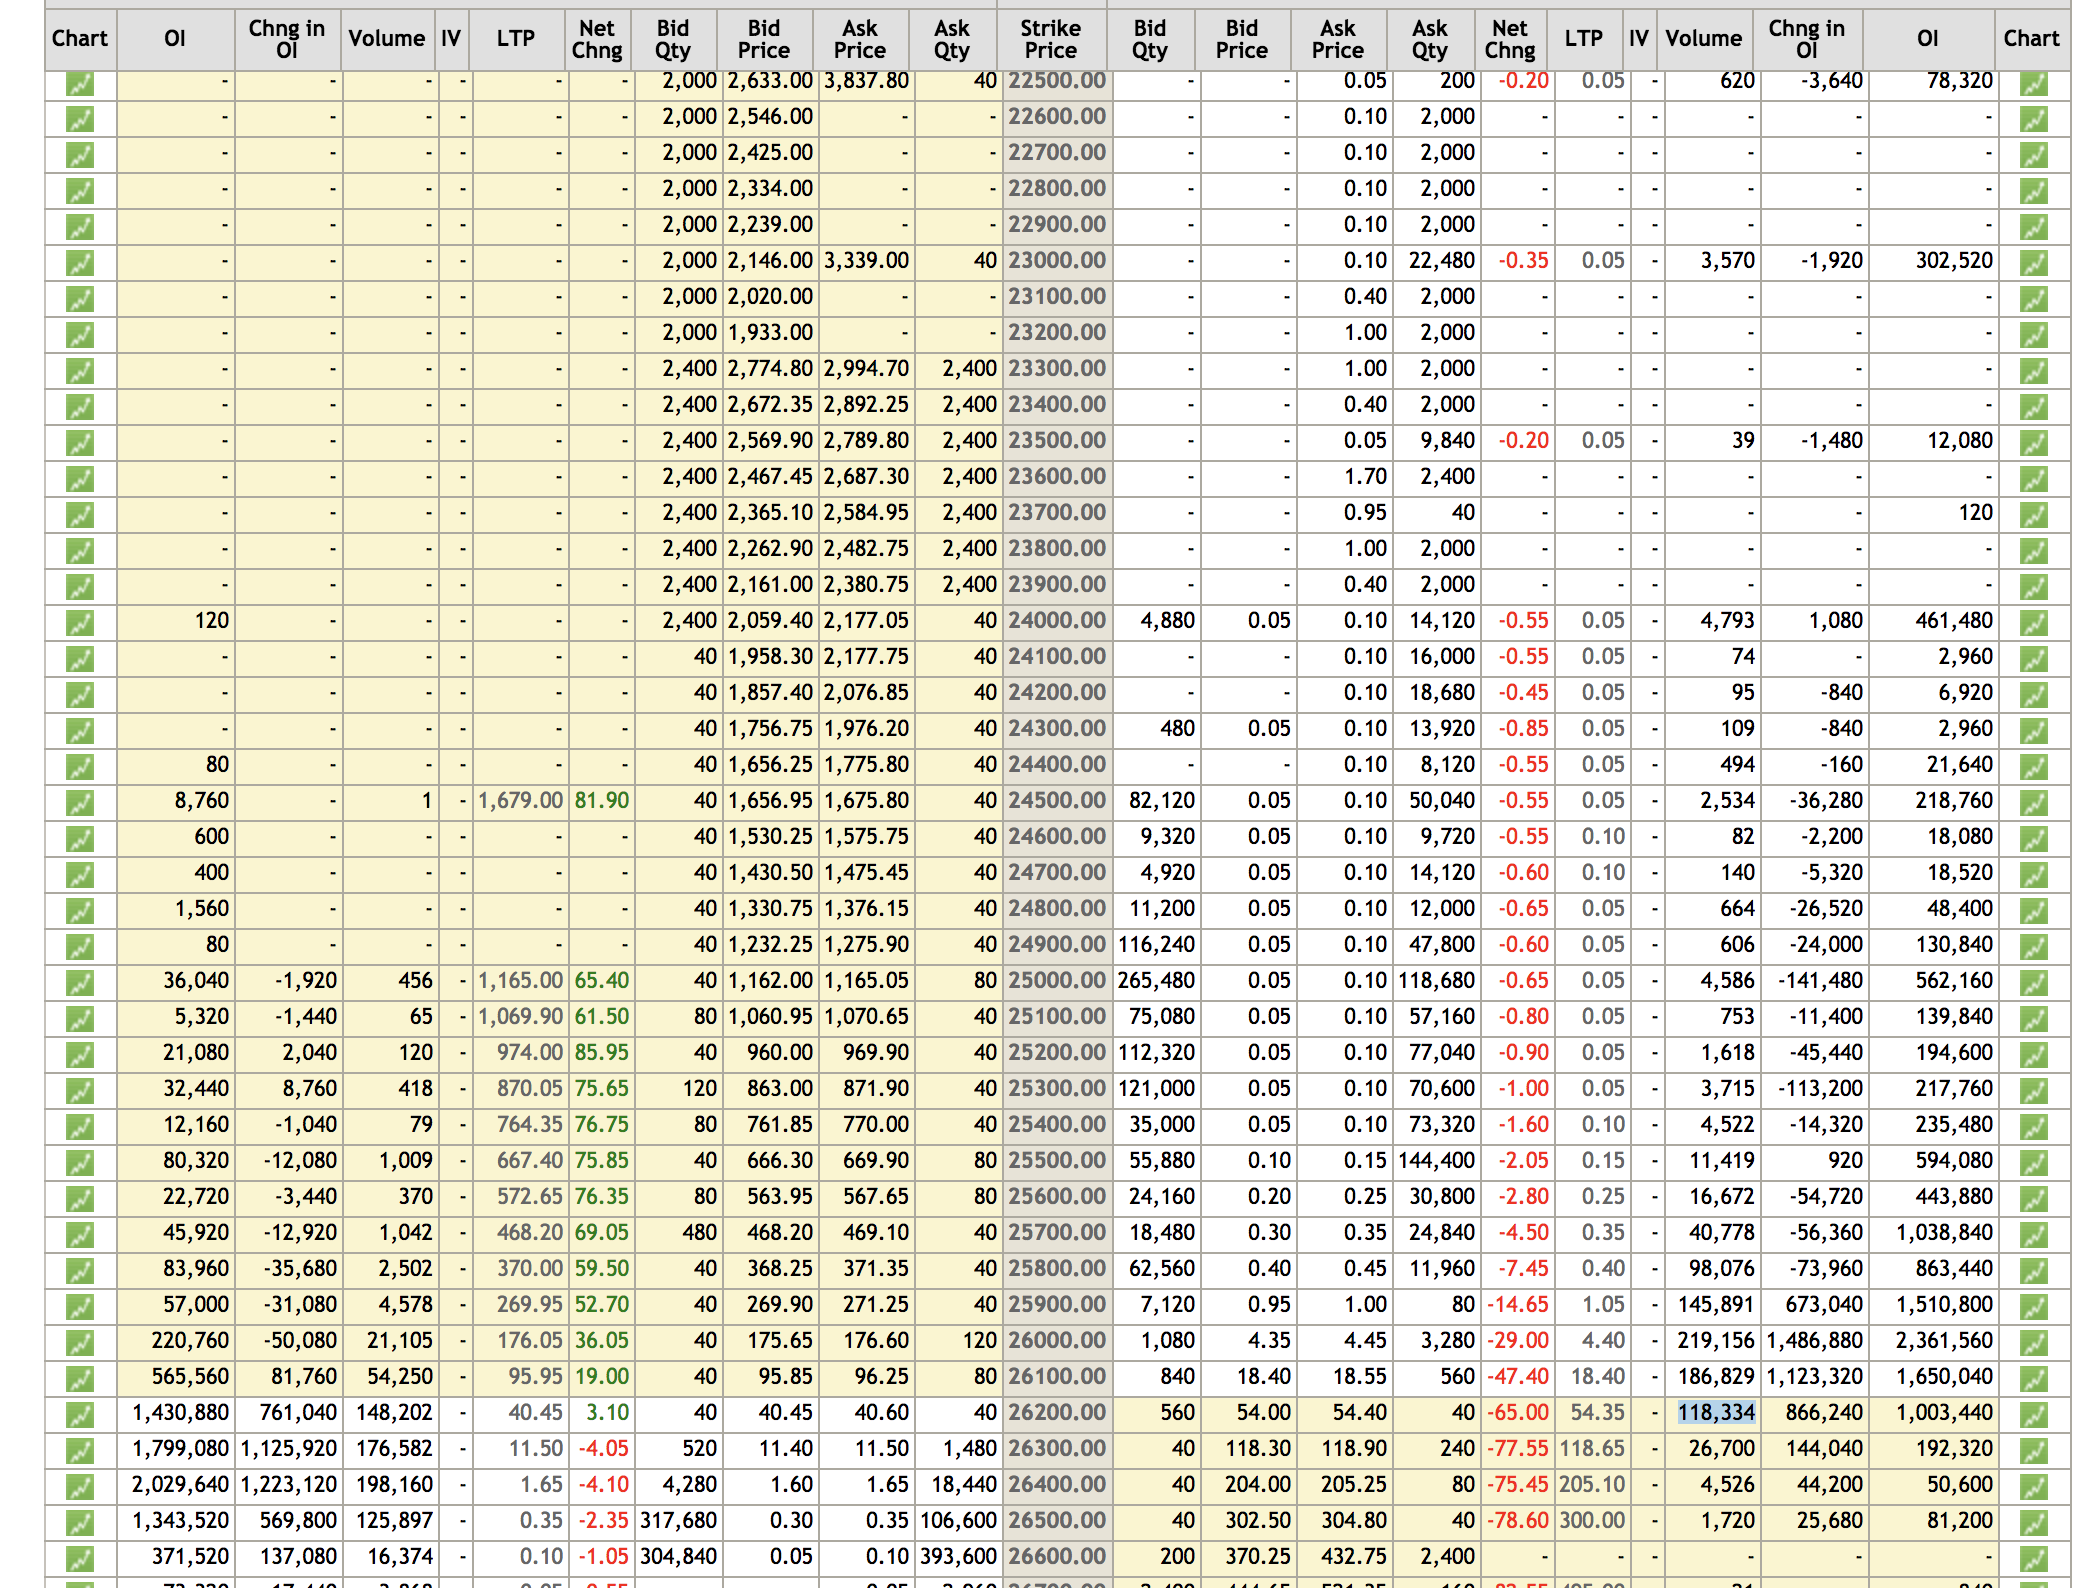
Is there any way that I can plot line diagram of open interest in kite chart? Also, I am not sure what type of volume it show for call/ put For exmaple attach is screen shot of bank nifty 10 may 26100 put & nse option cha in screen shot. The volume mentioned in the 1 min chart & total voulme mentioned in option chain not matched at all & not make sense.