☰
Login
Signup
Home
›
General
Howdy, Stranger!
It looks like you're new here. If you want to get involved, click one of these buttons!
Sign In
Register
Categories
Recent Discussions
Activity
Categories
15.3K
All Categories
0
Incidents
183
Node JS client
52
Go client
868
.Net API client
407
Kite Publisher
557
.Net / VBA / Excel (3rd party)
509
Algorithms and Strategies
1.1K
Java client
1.3K
API clients
410
PHP client
4.4K
Python client
369
Mobile and Desktop apps
1.5K
Market data (WebSockets)
3.7K
General
In this Discussion
April 2018
sujith
April 2018
ankur0101
Why difference in candles after switching on Continuous data?
ankur0101
April 2018
in
General
Hi,
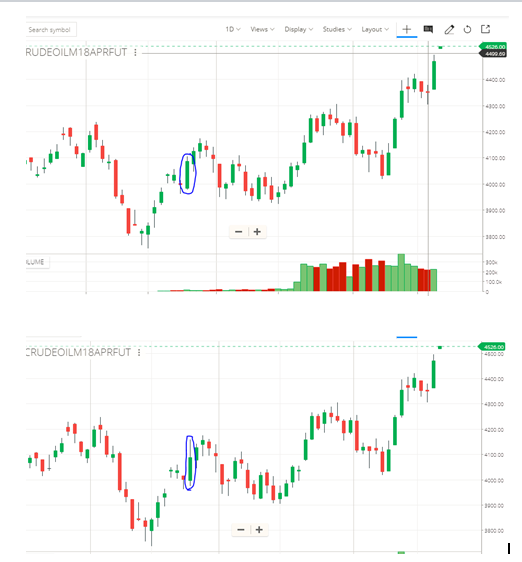
Why there is difference when we switch on Continuous data? The following screenshot is of crude oil.
In above image, first screenshot is of chart where continuous data is not ticked, the second one is the ticked one.
You can see the difference in the candles. Why?
Tagged:
crude oil
Continuous Data
image.png
67.9K
ankur0101
April 2018
@vivek
@sujith
need your help here.
sujith
April 2018
I agree ideally it shouldn't be different. But what is the point of this image, you need to provide more information if you expect people to spend time on the issue and provide a solution.
Sign In
or
Register
to comment.