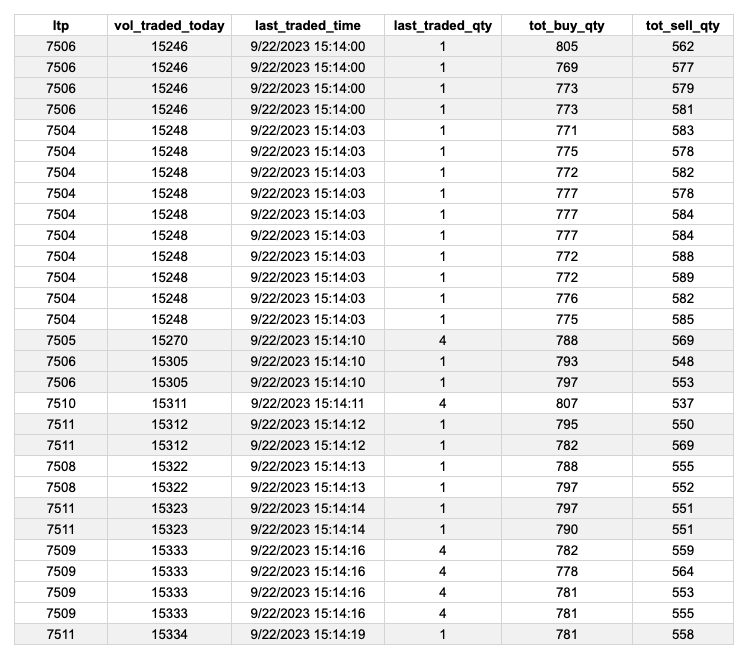
I am working with tick-level data and encountering a challenge in calculating the per-minute volume. Specifically, when I sum up the last_traded_quantity for each tick, the resulting total doesn't align with the difference in volume_traded between consecutive last_traded_time entries.
For instance, if I take the difference between the volume_traded values at two consecutive last_traded_time timestamps, it doesn't match the sum of last_traded_quantity for the trades that occurred within that time frame.
Could you provide some guidance on how to accurately compute the per-minute volume from this data?
At start of day your volume is zero. For first minute you get all ticks from first tick received to 09:15:59 (this condition can be written as 1)<= to 9:15:59 or 2)<9:16:00 ) and compute the OHLC. For the volume(V), the volume in the last tick is volume for first candle. Lets call this V1 You need to be able to save and reference this . For the second minute you get all ticks from 09:16:00 to 09:16:59 and compute the OHLC for the second minute. For the volume you need to find the volume in the last tick again. Lets call this TV2. Now volume for second candle V2 = TV2 - V1. For the third candle it will be V3 = TV3-V2 and so on.
Some folks subtract the volume in last tick from volume of first tick for the given minute as its easier to implement. And that will definitely result in error.
Thanks for the response. Your approach aligns with what I had in mind. I'm not sure why Zerodha doesn't provide volume directly in their tick data; it might help avoid confusion.
This clears up one aspect for me. Now, I'm wondering how we can differentiate the volume: how much is from taking the offer (buying volume) versus hitting the bid (selling volume)?
I am not part of zerodha team. But I do know that Tickdata is raw data that comes from the exchange and is forwarded as is. So if it does not contain volume computed thats on the exchange.
If zerodha takes each tick and tried to compute the volume before forwarding it then there will be a delay in the ticks. Now we don't want that. That is why the historical api which gives OHLCV typically lags 30-40 seconds behind the minute turnover when folks try to poll it for current days data.
Regarding the second para "how we can differentiate the volume: how much is from taking the offer (buying volume) versus hitting the bid (selling volume)? " Your question is irrelevant - volume is for completed transactions - where a bid matched an offer and hence the trade was made. So if for the first minute the volume was 10,000 that means 10,000 stocks the bids matched the offers and hence the trades were made.
Now if you look at the above screenshot of market depth for BANKNIFTY23O0444400PE you will see that in addition to the top 5 bids and offers, you get the total bids and offers. In this screenshot its 138295 bids and 331770 offers. But thats what is available to buy/sell. Not completed transactions.
What you get in tickdata is number of completed transactions. So if volume is V, that means V bids matched V offers.
Thanks buddy for the detailed explanation. I am familiar with the basics of the order book and how volume represents completed transactions where bids match offers. My query primarily revolves around the differentiation of volume, specifically in the context of order flow analysis.
Order flow charts, often provide a breakdown of volume at each price level, indicating how much was executed as bids versus offers. This differentiation can give insights into aggressive buying or selling activity. For instance, trades executed at the current best offer price can be considered aggressive buying, while those at the best bid price can be seen as aggressive selling.
With that context, my main interest is understanding how platforms differentiate this volume in real-time. How is the aggressive buying or selling volume, as seen on order flow charts, typically calculated from tick data or other sources? I'm keen to get a deeper understanding of this aspect of volume analysis.
I dont think that data is provided at all to anyone. Not even the HFT guys who have million rupee colocation setups. Only way to do that would be to see the entire market depth and then try to backtrace how many orders were executed from the available bids and offers for each price. For that you will need L2/L3 data and for one to be able to afford the compute needed to process that in realtime, lets not even talk about the costs involved - will probably be multiples of crores.
@rohanrg@MAG On Kite charts, we calculate the total volume for that interval candle as Tick.VolumeTraded(last tick for the candle interval) - Tick.VolumeTraded(start of the candle interval timestamp)
Thanks @rakeshr , can you see my second query and see if it's possible to derive this type of data? Platforms like GoCharting provides this type of data in real time and it doesn't look computationally heavy based on the pricing they are charging and latency at which we get that, there should be a smart way or a different source for this type of data.
Adding below the codes for community's benefit to compute volume for different time intervals based on the logic we discussed in this thread, I am using TimescaleDB to store tick level data and aggregating it to different time intervals in real time in backend. Continuous Aggregate feature in TimescaleDB helps in automatically updating aggregate values, such as max, min or sums, at specified time intervals, reducing the computational overhead.
-- Create a 15-minute aggregate view of tick data CREATE MATERIALIZED VIEW tick_15min WITH (timescaledb.continuous) AS SELECT time_bucket('15 minutes', timestamp) as timestamp, symbol, FIRST(price, timestamp) AS open, MAX(price) AS high, MIN(price) AS low, LAST(price, timestamp) AS close, LAST(volume_traded, timestamp) - FIRST(volume_traded, timestamp) AS volume FROM tick_data GROUP BY symbol, time_bucket('15 minutes', timestamp);
-- Set a continuous aggregate policy to refresh the 15-minute view SELECT add_continuous_aggregate_policy('tick_15min', start_offset => INTERVAL '1 month', end_offset => INTERVAL '15 minutes', schedule_interval => INTERVAL '15 minutes');
By using this approach, the database will automatically handle the volume calculations for you, ensuring you have up-to-date 15-minute aggregates without any manual intervention. I hope this helps!
Hey, I figured out the second query as well! For those of you trying to determine aggressive buying and selling volumes from tick data, here's a method I followed -
highest_bid = max([bid['price'] for bid in tick['depth']['buy']]) lowest_ask = min([ask['price'] for ask in tick['depth']['sell']])
The logic for this determination is based on the premise that aggressive buyers will accept the current offer price (i.e., they'll "lift the offer"), and aggressive sellers will hit the current bid price. Using this method, we can classify the nature of the trades more accurately and gain insights into the aggressive buying and selling behaviour in the market.
Hi @rohanrg Rohan, I hope you doing good. were you able to calculate order aggressive market buy or sell order to compute order flow analysis, using above calculation?
does it match with go charting order flow and imbalance?
I mean I am also trying to create order flow using tick data and bid and ask spread. But till now not able to come up with the logic for the same.
@nikhilalgo I would like to add the statement that finding imbalances is an extremely amateur way of doing analysis and is not relevant in the modern trading world. What is happening in the market is exactly opposite what we learned from the books. Actually, this is a game where very smart people are on one side and amateurs are on the other. Finally, the smart people will win.
If imbalance is good for finding magnificent trades or most common methods, then everyone would have become successful traders.
@ANL Thanks for reply. Finding imbalance may or may not be a amateur way of doing analysis, but I link to find it by doing and applying it. I am new and still learning. If you know how to calculate imbalances from tick data please let me know. I am coding the same in python. I think you also using python for you analysis and trading. On the hand if you know a better way to do analysis, I am happy to learn the same from you.
@nikhilalgo@rohanrg Namastey Nikhil & Rohan, I am also trying to use AI and ML to make my trading better! I think we all people trying to do the same can have a whatsapp group where we share our insights and help each other so that the goal can be achieved faster! if you think this can be a better approach please join the group and also make your peers who are doing the same join this! link - https://chat.whatsapp.com/BwhDDeS7bkDI7K7aAmdGP5
Market moves from external range liquidity to internal range liquidity because of inefficiencies / imbalances in the market. It's certainly not an amateur way, however one must combine that with other entry level models to take an entry. @nikhilalgo, I did find the aggressive volume using the logic I have mentioned above. However I found a better way to find imbalances which doesn't need this type of data, read about fair value gaps (FVGs) if you're interested. Point to note that, not all FVGs move the market, do you own research.
@rohanrg What I learned from my experience is that we can't exactly find liquidity because it will generate and vanish in milliseconds or seconds. Most liquidity providers are HFT, and they are market makers. As a retailers, we have many limitations as we only get a snapshot of TBT data. so it's not possible to determine the real liquidity. As we read or see in many threads related to liquidity, it actually describes volume analysis, not liquidity analysis.

For first minute you get all ticks from first tick received to 09:15:59 (this condition can be written as 1)<= to 9:15:59 or 2)<9:16:00 ) and compute the OHLC. For the volume(V), the volume in the last tick is volume for first candle. Lets call this V1 You need to be able to save and reference this .
For the second minute you get all ticks from 09:16:00 to 09:16:59 and compute the OHLC for the second minute. For the volume you need to find the volume in the last tick again. Lets call this TV2. Now volume for second candle V2 = TV2 - V1.
For the third candle it will be V3 = TV3-V2 and so on.
Some folks subtract the volume in last tick from volume of first tick for the given minute as its easier to implement. And that will definitely result in error.
This clears up one aspect for me. Now, I'm wondering how we can differentiate the volume: how much is from taking the offer (buying volume) versus hitting the bid (selling volume)?
If zerodha takes each tick and tried to compute the volume before forwarding it then there will be a delay in the ticks. Now we don't want that.
That is why the historical api which gives OHLCV typically lags 30-40 seconds behind the minute turnover when folks try to poll it for current days data.
@sujith please correct me if I am wrong.
Your question is irrelevant - volume is for completed transactions - where a bid matched an offer and hence the trade was made. So if for the first minute the volume was 10,000 that means 10,000 stocks the bids matched the offers and hence the trades were made.
Now if you look at the above screenshot of market depth for BANKNIFTY23O0444400PE
you will see that in addition to the top 5 bids and offers, you get the total bids and offers. In this screenshot its 138295 bids and 331770 offers. But thats what is available to buy/sell. Not completed transactions.
What you get in tickdata is number of completed transactions. So if volume is V, that means V bids matched V offers.
Order flow charts, often provide a breakdown of volume at each price level, indicating how much was executed as bids versus offers. This differentiation can give insights into aggressive buying or selling activity. For instance, trades executed at the current best offer price can be considered aggressive buying, while those at the best bid price can be seen as aggressive selling.
With that context, my main interest is understanding how platforms differentiate this volume in real-time. How is the aggressive buying or selling volume, as seen on order flow charts, typically calculated from tick data or other sources? I'm keen to get a deeper understanding of this aspect of volume analysis.
Only way to do that would be to see the entire market depth and then try to backtrace how many orders were executed from the available bids and offers for each price. For that you will need L2/L3 data and for one to be able to afford the compute needed to process that in realtime, lets not even talk about the costs involved - will probably be multiples of crores.
On Kite charts, we calculate the total volume for that interval candle as
Tick.VolumeTraded(last tick for the candle interval) - Tick.VolumeTraded(start of the candle interval timestamp)-- Create a 15-minute aggregate view of tick data
CREATE MATERIALIZED VIEW tick_15min
WITH (timescaledb.continuous) AS
SELECT
time_bucket('15 minutes', timestamp) as timestamp,
symbol,
FIRST(price, timestamp) AS open,
MAX(price) AS high,
MIN(price) AS low,
LAST(price, timestamp) AS close,
LAST(volume_traded, timestamp) - FIRST(volume_traded, timestamp) AS volume
FROM tick_data
GROUP BY symbol, time_bucket('15 minutes', timestamp);
-- Set a continuous aggregate policy to refresh the 15-minute view
SELECT add_continuous_aggregate_policy('tick_15min',
start_offset => INTERVAL '1 month',
end_offset => INTERVAL '15 minutes',
schedule_interval => INTERVAL '15 minutes');
By using this approach, the database will automatically handle the volume calculations for you, ensuring you have up-to-date 15-minute aggregates without any manual intervention. I hope this helps!
highest_bid = max([bid['price'] for bid in tick['depth']['buy']])
lowest_ask = min([ask['price'] for ask in tick['depth']['sell']])
buying_volume = selling_volume = 0
if highest_bid <= price < lowest_ask:
selling_volume = tick['last_traded_quantity']
elif lowest_ask >= price > highest_bid:
buying_volume = tick['last_traded_quantity']
The logic for this determination is based on the premise that aggressive buyers will accept the current offer price (i.e., they'll "lift the offer"), and aggressive sellers will hit the current bid price. Using this method, we can classify the nature of the trades more accurately and gain insights into the aggressive buying and selling behaviour in the market.
I hope you doing good. were you able to calculate order aggressive market buy or sell order to compute order flow analysis, using above calculation?
does it match with go charting order flow and imbalance?
I mean I am also trying to create order flow using tick data and bid and ask spread. But till now not able to come up with the logic for the same.
If you can help me our here that will be great.
If imbalance is good for finding magnificent trades or most common methods, then everyone would have become successful traders.
On the hand if you know a better way to do analysis, I am happy to learn the same from you.